
An image model that returns a picture faster has answered only the first part of a comparison. The scene might still be wrong. The character could be duplicated, the requested prop missing or the final resolution produced by an additional upscale pass.
That is why we separate generation timing from visual fidelity.
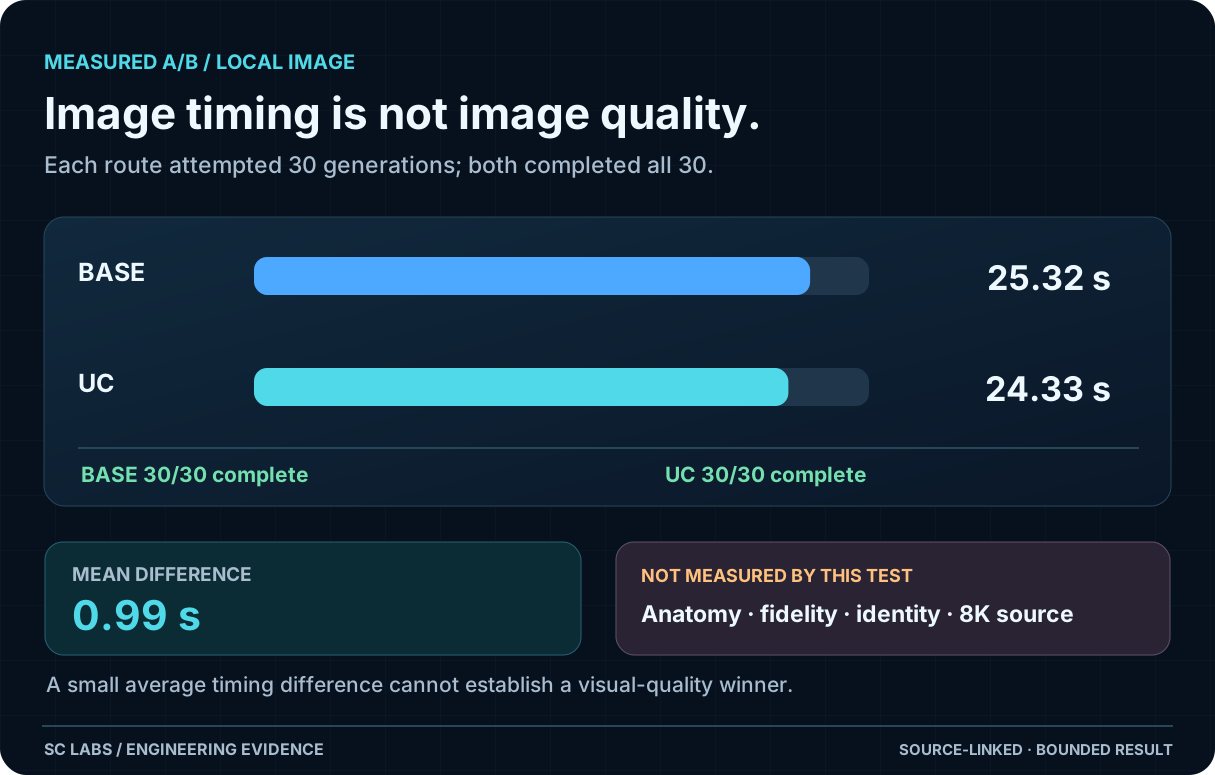
In a local A/B test of our Qwen image setup, two configurations each attempted thirty generations. Both completed all thirty. The summary recorded mean durations of 25.32 seconds for the base route and 24.33 seconds for the UC route.
The difference in these mean durations was 0.99 seconds, about 3.9% of the base mean. That is a result for this retained test, not a promise that one variant is universally faster or visually better. The summary does not establish a winner for hands, identity, text accuracy or other image-quality requirements.
Our SC Agent Lab separates tested results from product claims; image timing should be recorded with the same care.
The A/B timing summary records attempts, completions and mean durations. It contains no visual grading, so it cannot select a quality winner.
Freeze the prompts and the machine
A fair run keeps the hardware, backend version, prompt set and output settings consistent. Randomisation and cache effects should be documented, as should the order of runs.
If different variants require different prompt conventions, declare them. Compare the outcome against the same intended scene contract rather than insisting that identical syntax necessarily means equivalent conditioning.
Record whether each attempt completed, its elapsed time, output dimensions and any retry or fallback.
Grade the picture separately
A useful rubric checks prompt faithfulness, people and object counts, obvious anatomy problems, text correctness, composition and continuity with a reference.
A second pass can include aesthetic judgement, but it should not cover for basic omissions. If the task called for one duck, two ducks is a failure regardless of how attractive the picture looks.
For sequences, inspect continuity across consecutive frames rather than the best frame alone. Our character-consistency method explains why reference choices can introduce their own problems.
When consistency matters, use the reference-frame sequence method instead of judging single frames in isolation.
A vision-model validator can add a second check, but its errors must also be measured.
Don't hide the upscale stage
An exported file may be 8K even if the underlying generator worked at a lower resolution and a separate upscaler created the final dimensions. Document both stages, including input resolution, output resolution, model and editing steps.
Similarly, do not compare a preview image from one candidate with a carefully cleaned and upscaled image from another.
What the report should show
Keep a table for completion rate and timing. Keep another for rubric scores and representative failures. Save the exact prompts, seeds and output artefacts so a reviewer can inspect the examples.
When a user needs consistent story characters, the best average aesthetics may not be the winning choice. When a user wants a quick background concept, speed may matter more. The benchmark has to answer the user's real job.
Test boundary: The 30-versus-30 completion and mean duration figures are taken from the saved internal summary. The same summary is insufficient to establish visual-quality superiority.